Jacksonville
Waterfront Homes for Sale in Jacksonville
478 homes · 31 new this week · median $536,450 · 1,268 sold in 12 mo at median $491,000 · 93 days avg on market · updated 7 minutes ago
Part of the Waterfront & Boating guide — every kind of Northeast Florida water →
Market Snapshot
As of November 8, 2026, the median list price for waterfront homes in Jacksonville is $536,450 across 478 active listings, averaging $355/sqft; recent MLS-recorded sales show a median sold price of $491,000 across 1,268 closings.
- Median List Price
- $536,450
- Avg. Price / Sq Ft
- $355/sqft
- Median Sold (12 mo, MLS)
- $491,000
- ▲ 6.7% vs prior 6 mo
- Active Listings
- 478
- HOA Dues
- ~$267/mo typical
- 366 of 478 listings carry dues
What’s for sale: 474 homes (median $528,952) · 4 multi-family (median $4.5M)
Market stats are based on waterfront homes in Jacksonville, including 1268 recent recorded sales — they may not include listings or sales that aren't comparable to this market. Sourced from the MLS; refreshed regularly.
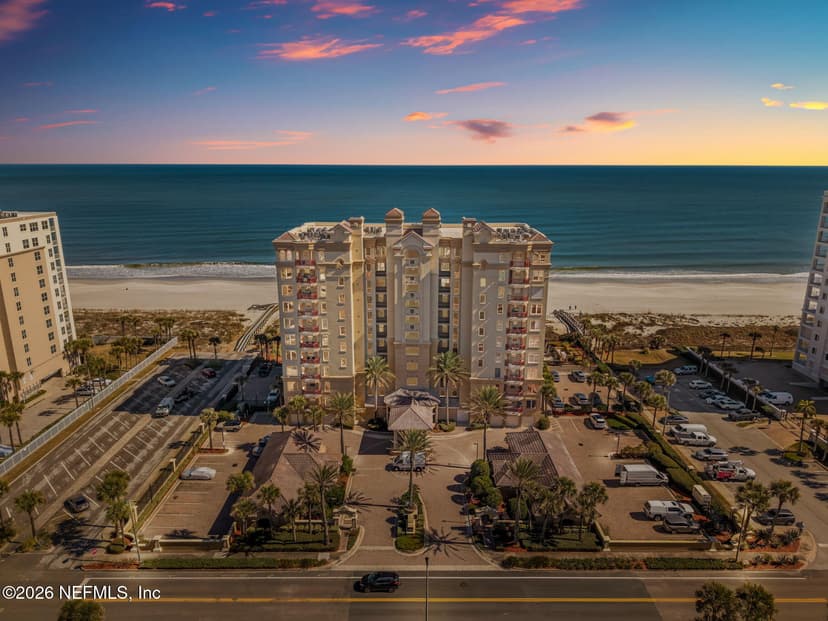
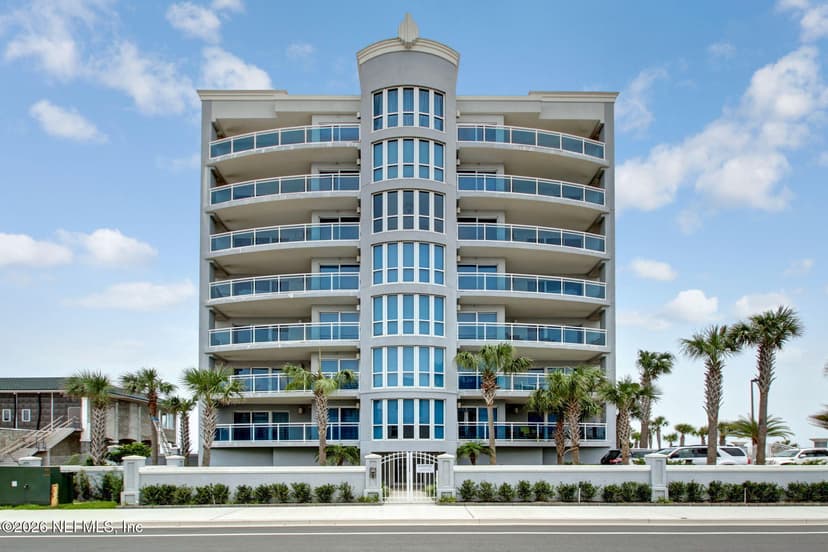
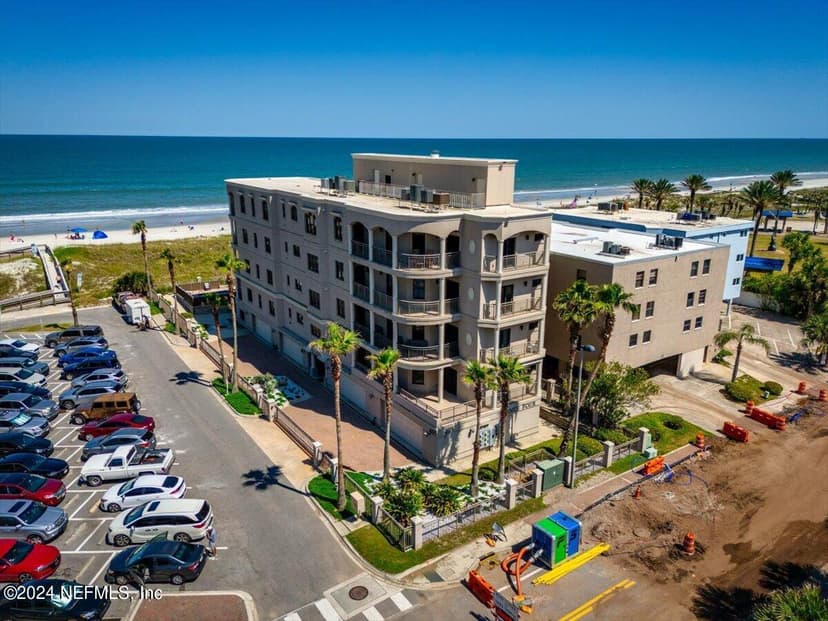
Oceanfront condos44 condos · from $275,000
Oceanfront and ocean-access condo buildings along the coast.
Jacksonville Beach (32) · Atlantic Beach (4) · Mayport & other (8)
Oceanfront & ocean-access homes25 homes · from $549,900
Houses and townhomes on the Atlantic or with deeded access to it.
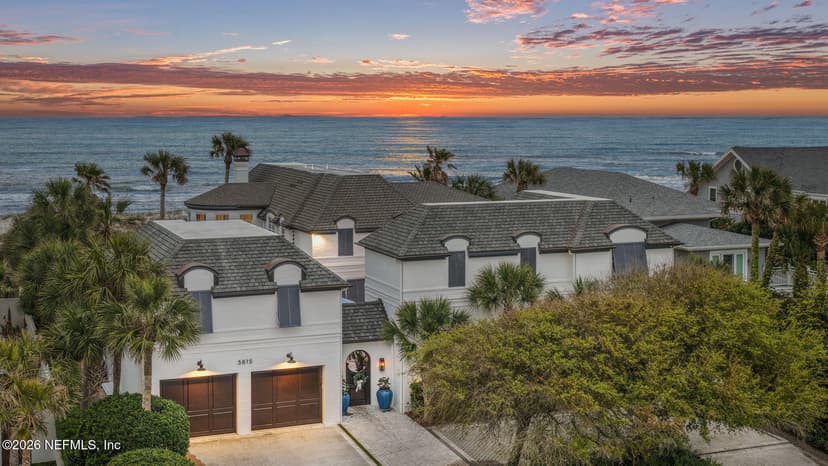
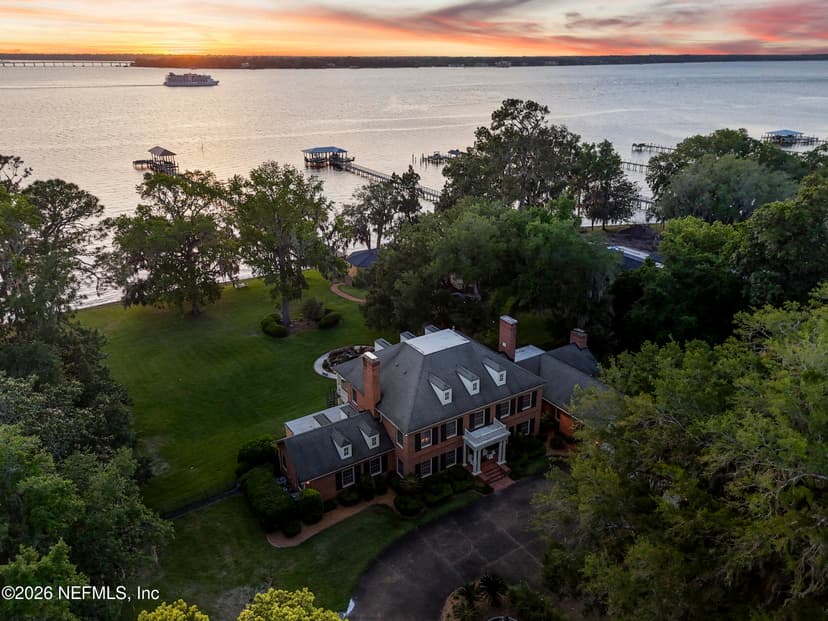
Jacksonville, FL 32223
5 bd · 6 ba · 6,644 sq ft
FEMA Zone X · Evac D
Listing Office: berkshire hathaway homeservices florida network realty
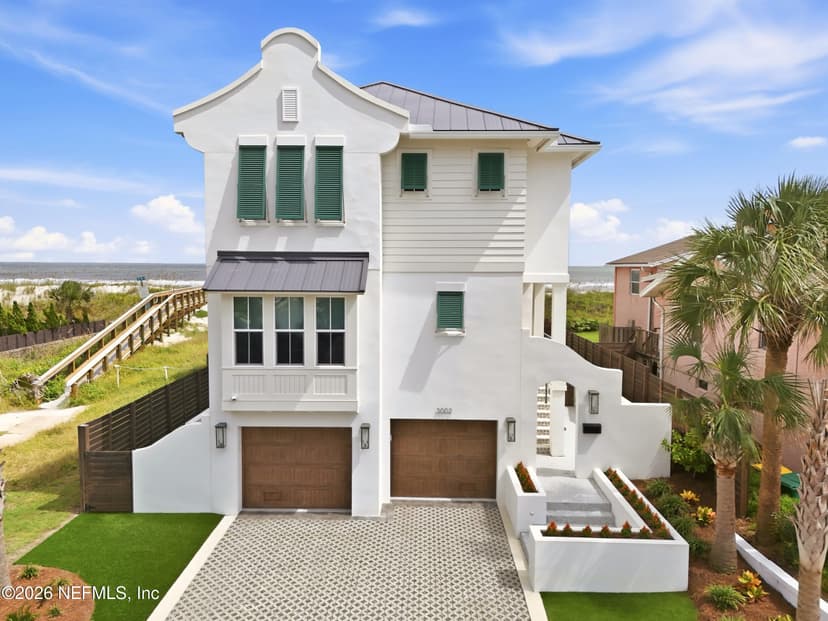
Private docks, slips & lifts68 homes · from $189,000
A dock, boat slip, or lift on the property itself — river, Intracoastal, or canal. The whole region’s dock inventory lives on the dock & boat-slip page. All Northeast Florida dock & boat-slip homes →
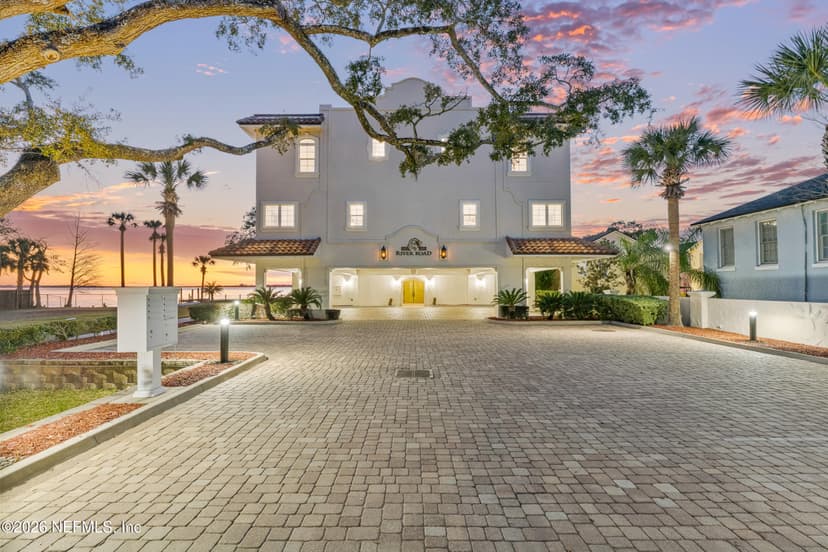
Income
Jacksonville, FL 32207
20 bd · 18 ba · 16,244 sq ft
FEMA Zone AE · Evac A
Listing Office: engel & volkers first coast
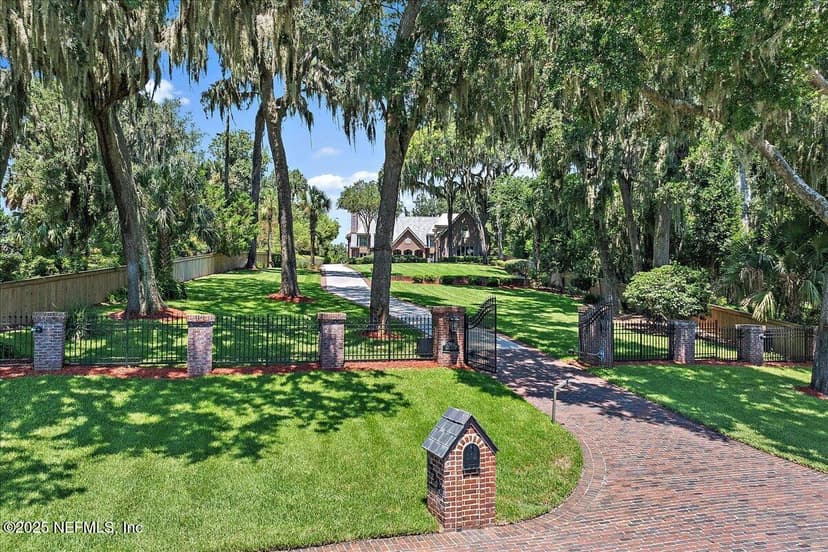
Jacksonville, FL 32225
7 bd · 6 ba · 8,476 sq ft
House in Zone X · Evac A
Listing Office: watson realty corp
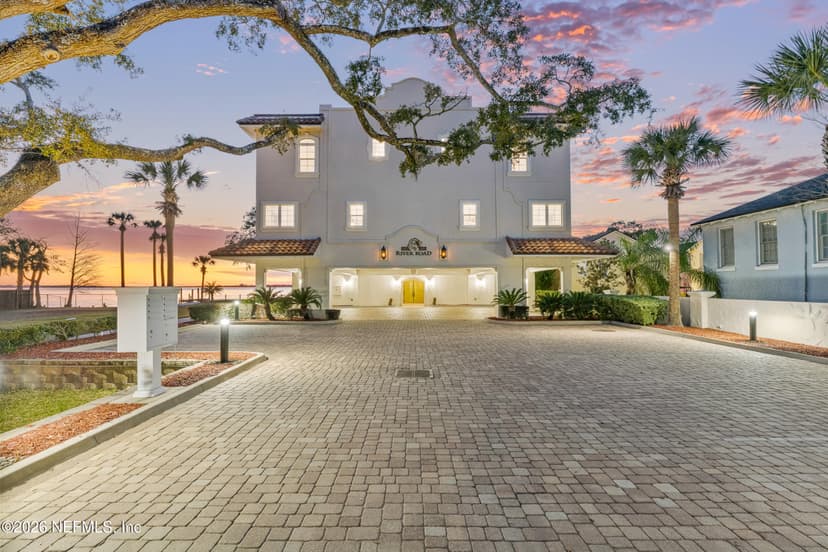
Income
Jacksonville, FL 32207
20 bd · 18 ba · 16,244 sq ft
FEMA Zone AE · Evac A
Listing Office: engel & volkers first coast
Riverfront & river access62 homes · from $215,000
The St. Johns on the county’s west side, and the Tolomato and Matanzas along the coast corridor.
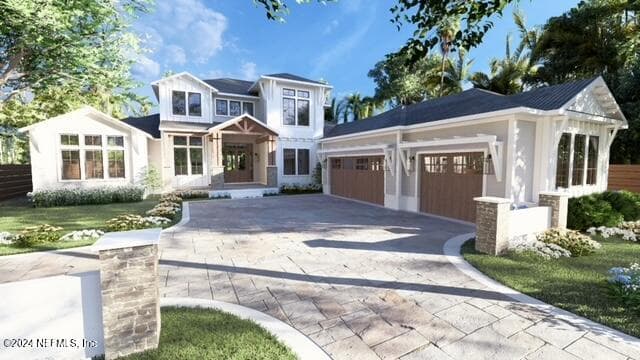
Jacksonville, FL 32257
4 bd · 4 ba · 3,870 sq ft
FEMA Zone X · Evac D
Listing Office: watson realty corp
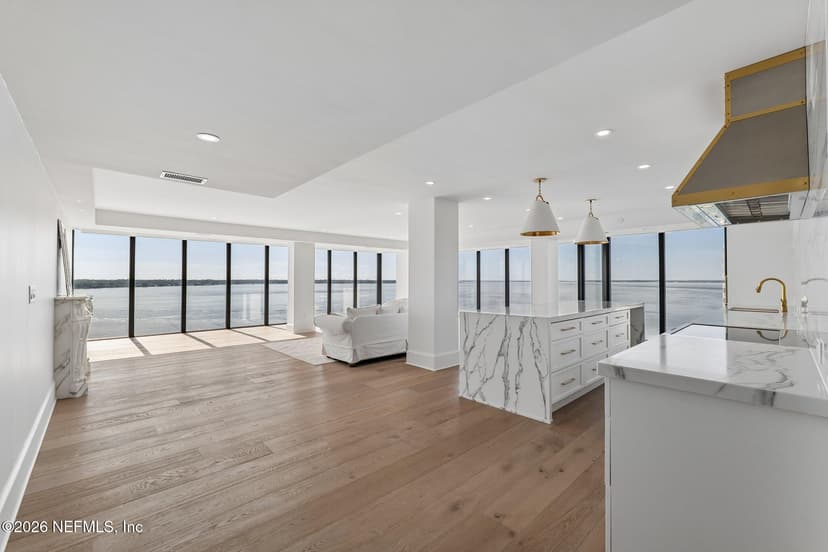
Jacksonville, FL 32204
2 bd · 3 ba · 3,600 sq ft
FEMA Zone X · Evac B
Listing Office: coldwell banker vanguard realty
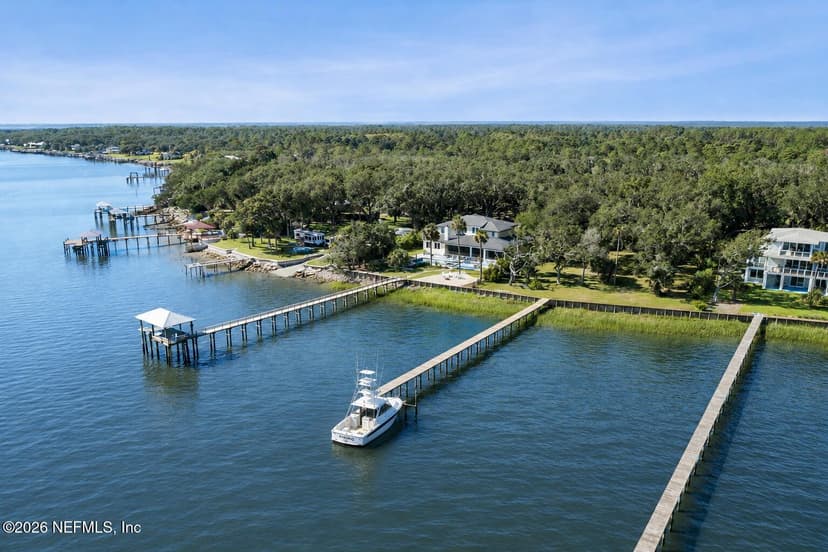
Jacksonville, FL 32226
5 bd · 5 ba · 4,854 sq ft
FEMA Zone X · Evac A
Listing Office: christie's international real estate first coast
Intracoastal, canals & navigable water24 homes · from $189,000
Boatable water that isn’t ocean- or river-fronted — Intracoastal frontage and navigable canals.
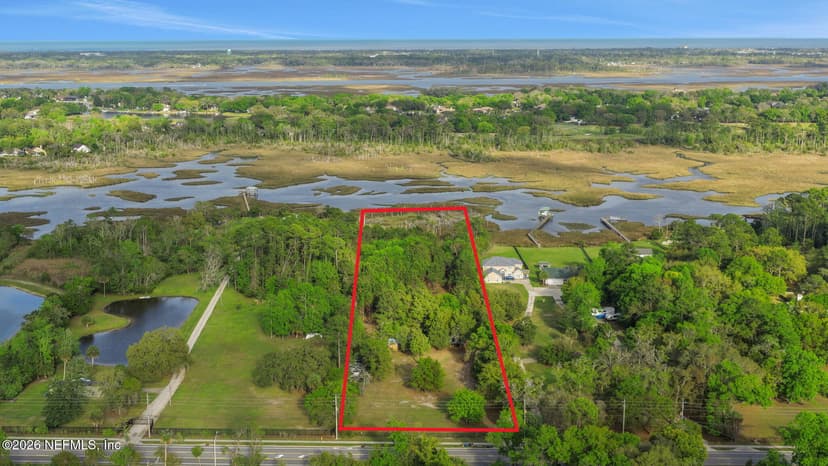
Jacksonville, FL 32225
2 bd · 1 ba · 960 sq ft
FEMA Zone X · Evac A
Listing Office: peninsula properties realty inc
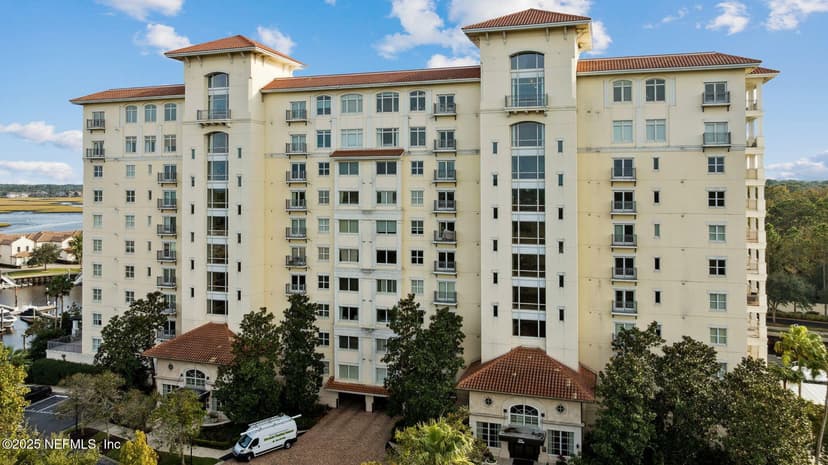
Jacksonville, FL 32224
4 bd · 4 ba · 3,345 sq ft
FEMA Zone X · Evac A
Listing Office: re/max specialists pv
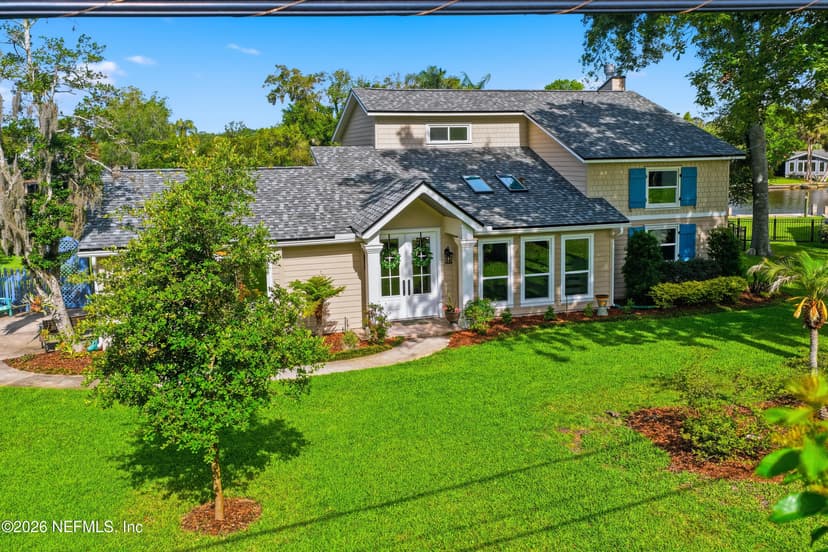
Jacksonville, FL 32224
4 bd · 3 ba · 2,661 sq ft
FEMA Zone X · Evac C
Listing Office: better homes & gardens real estate lifestyles realty
Lakes, ponds, marsh & creek frontage255 homes
The rest of the county’s waterfront designations — community lakefront, the ponds most newer communities are built around (many are stormwater systems), plus marsh and creek frontage. What the water actually is varies listing to listing — ask and I’ll verify.
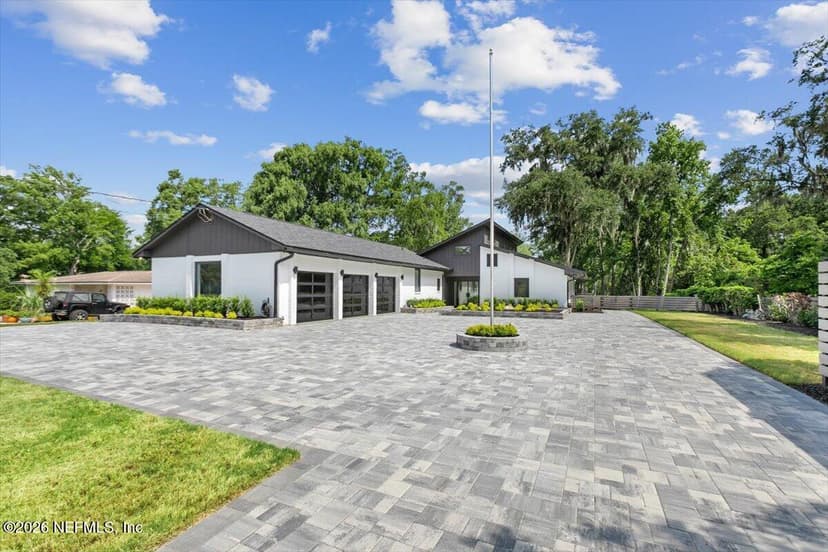
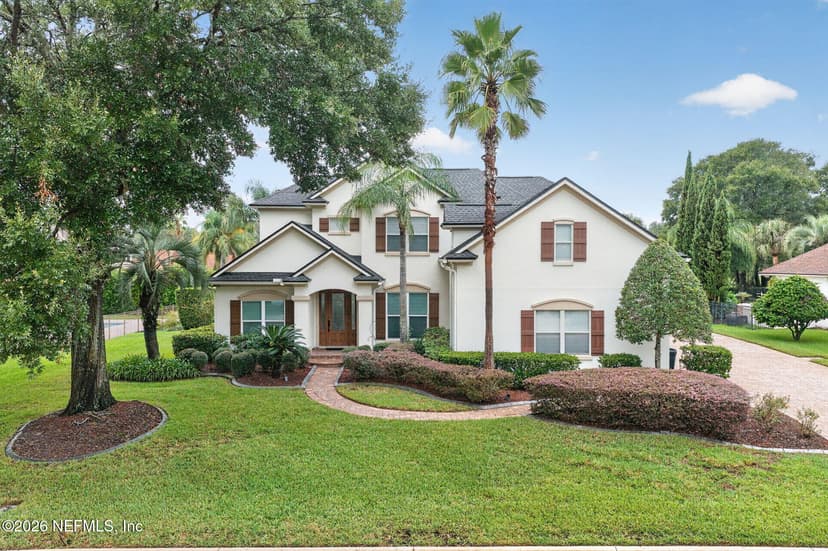
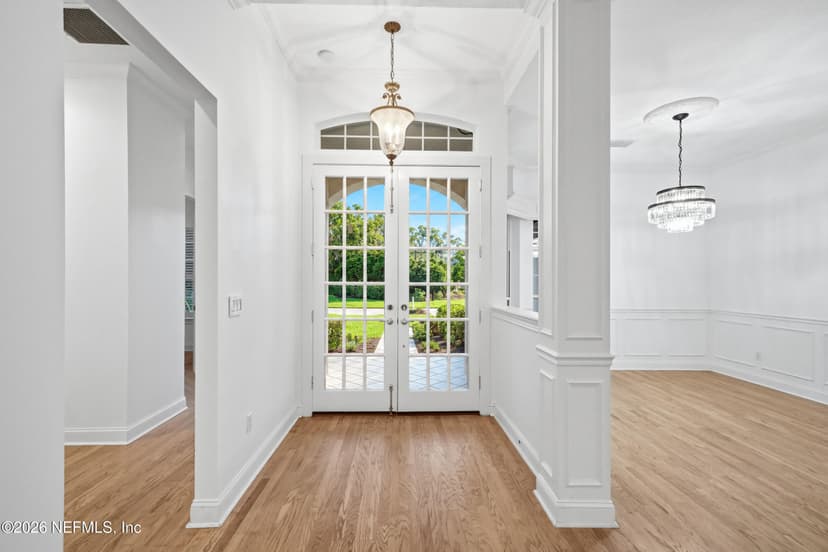
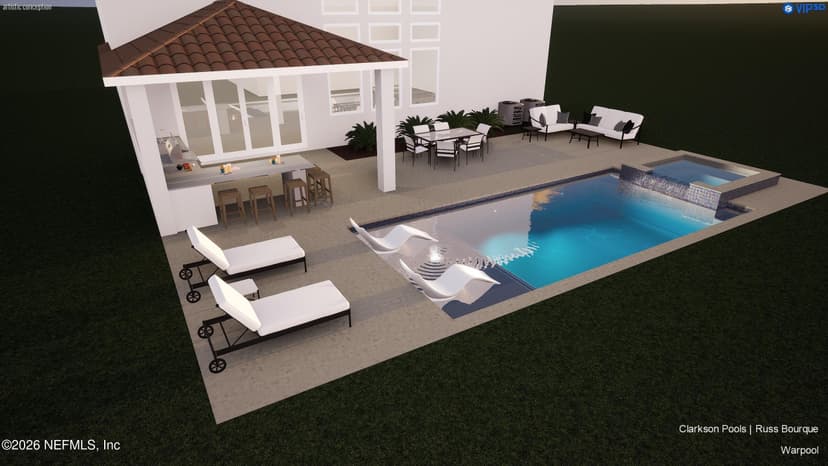
All 23 Other Waterfront Homes for Sale in Jacksonville
Showing the 119 highest-priced matches — use the filters to narrow, or search the full map.
Showing 23 of 23
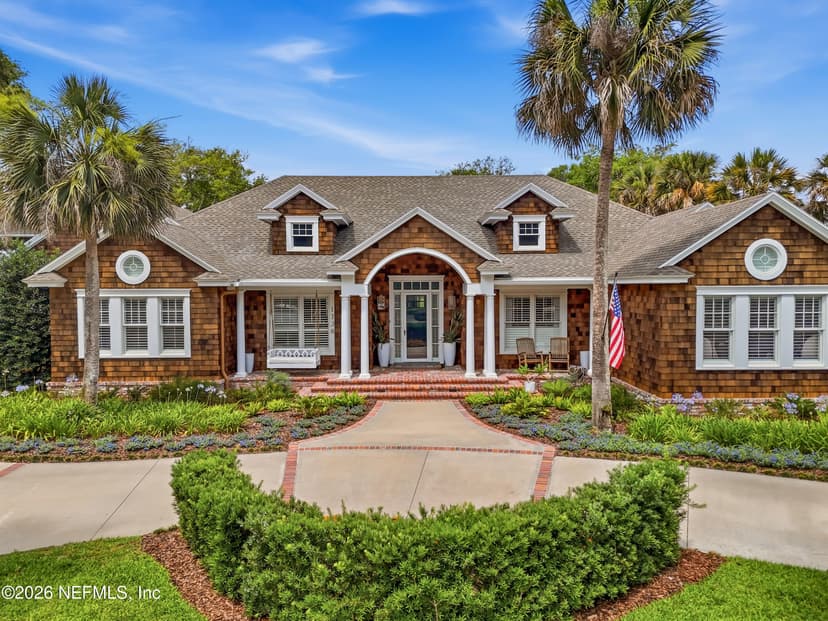
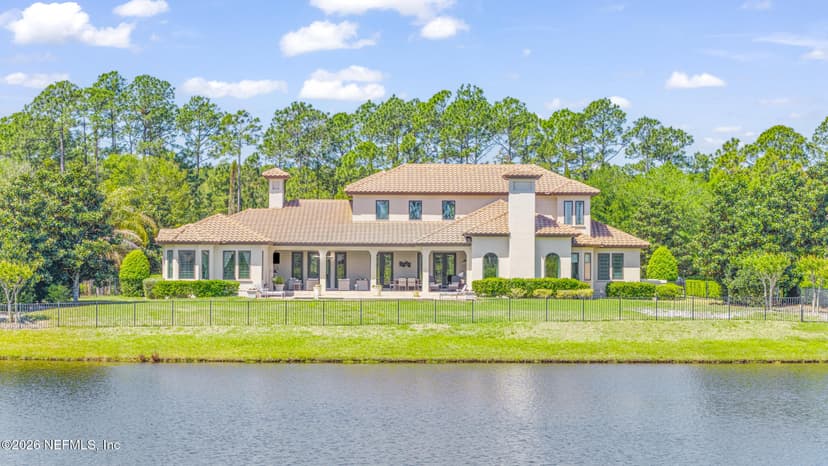
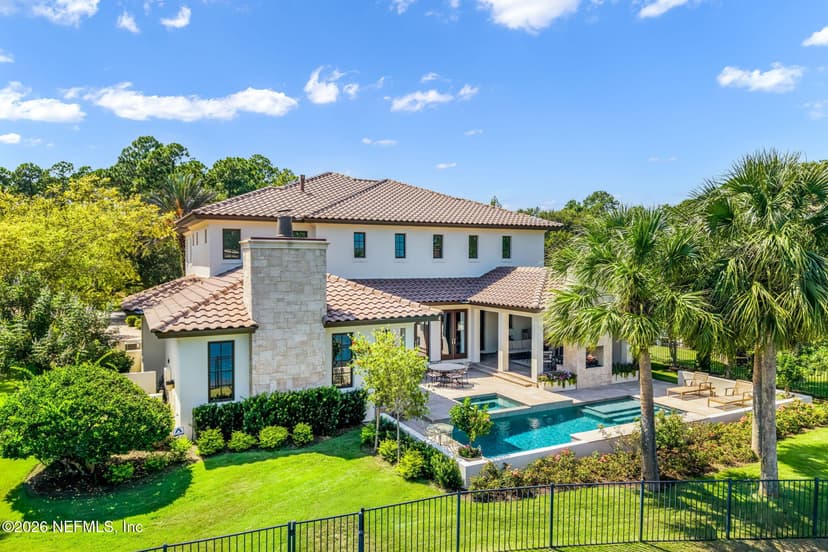
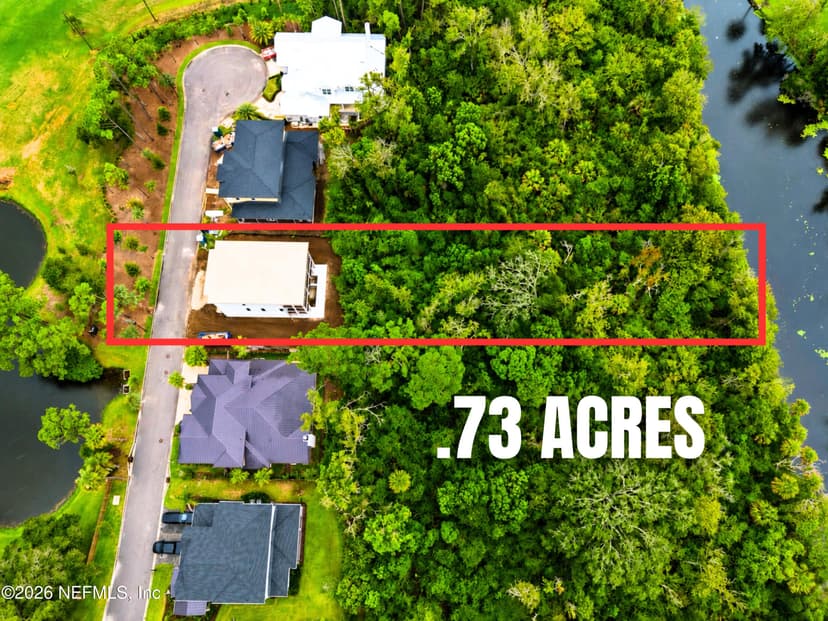
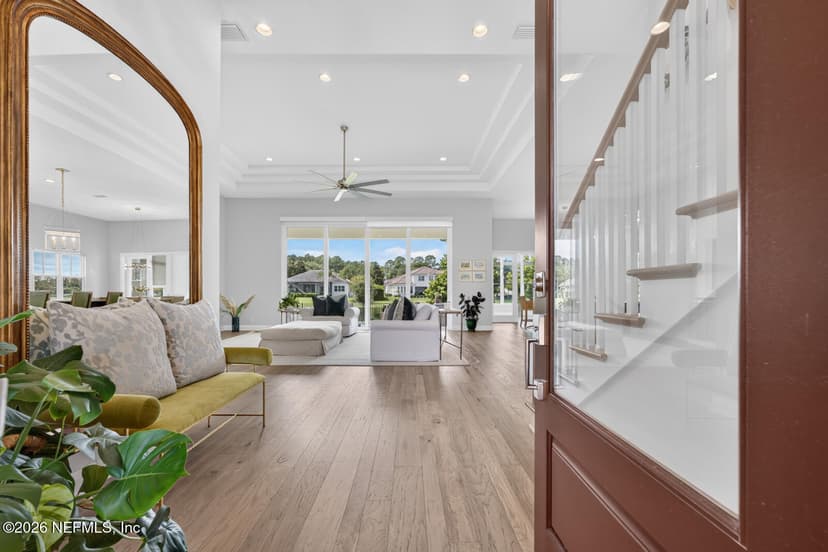
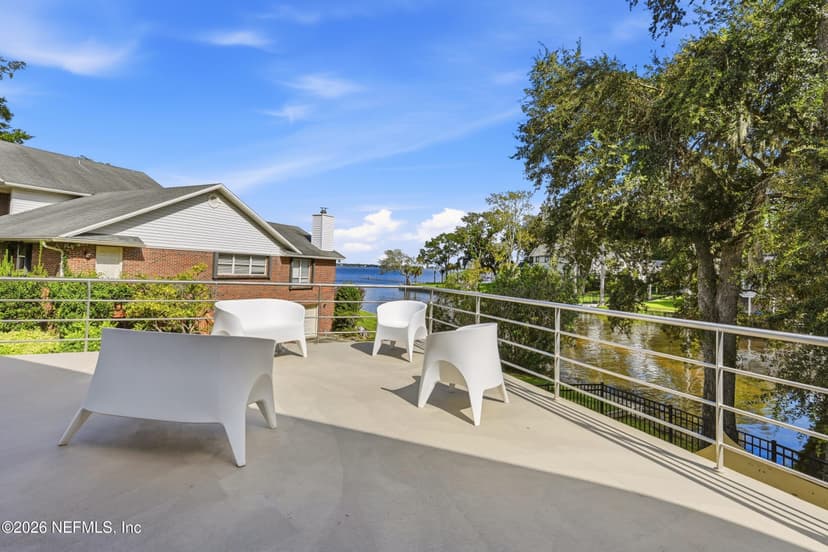
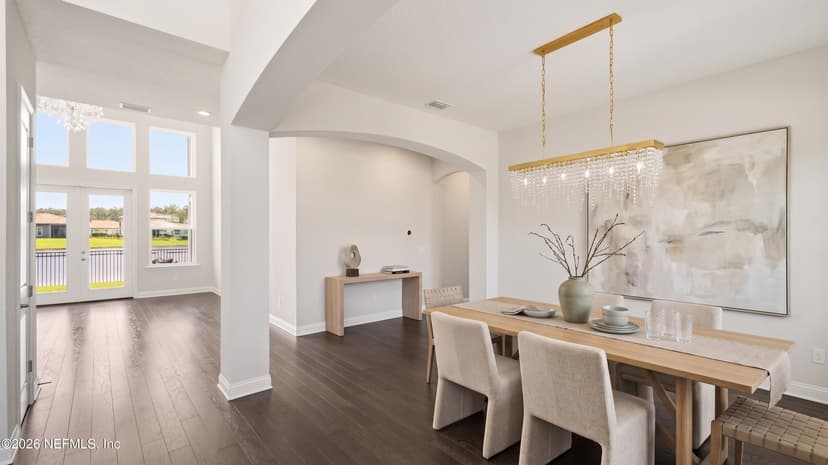
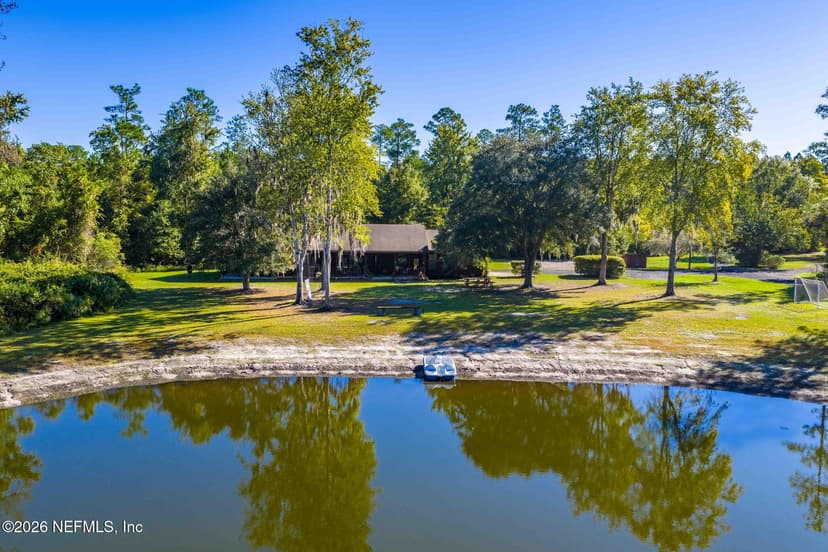
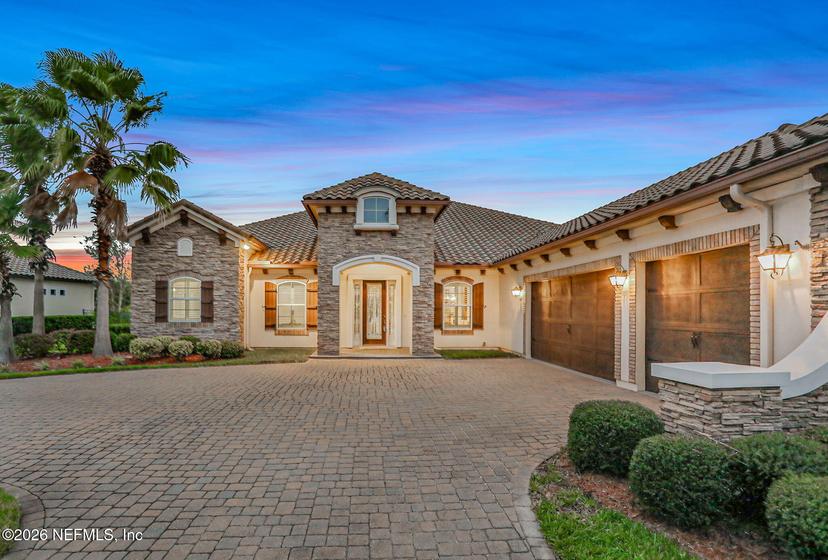
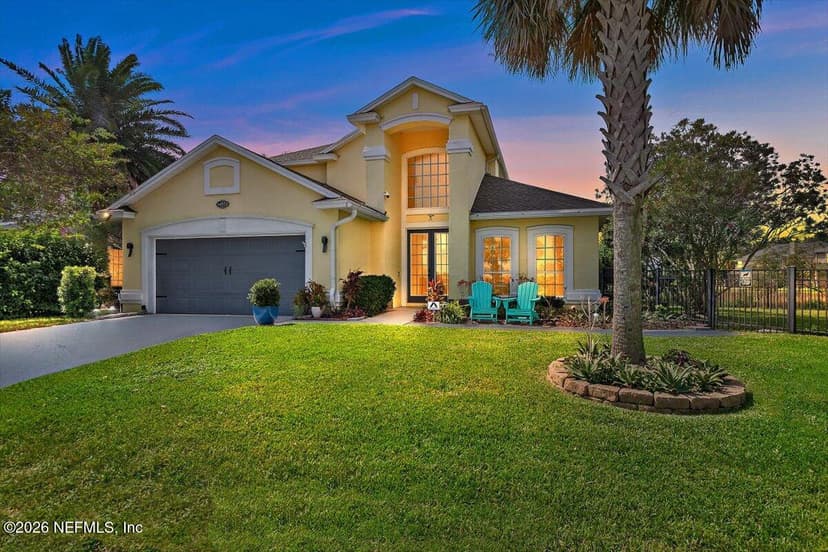
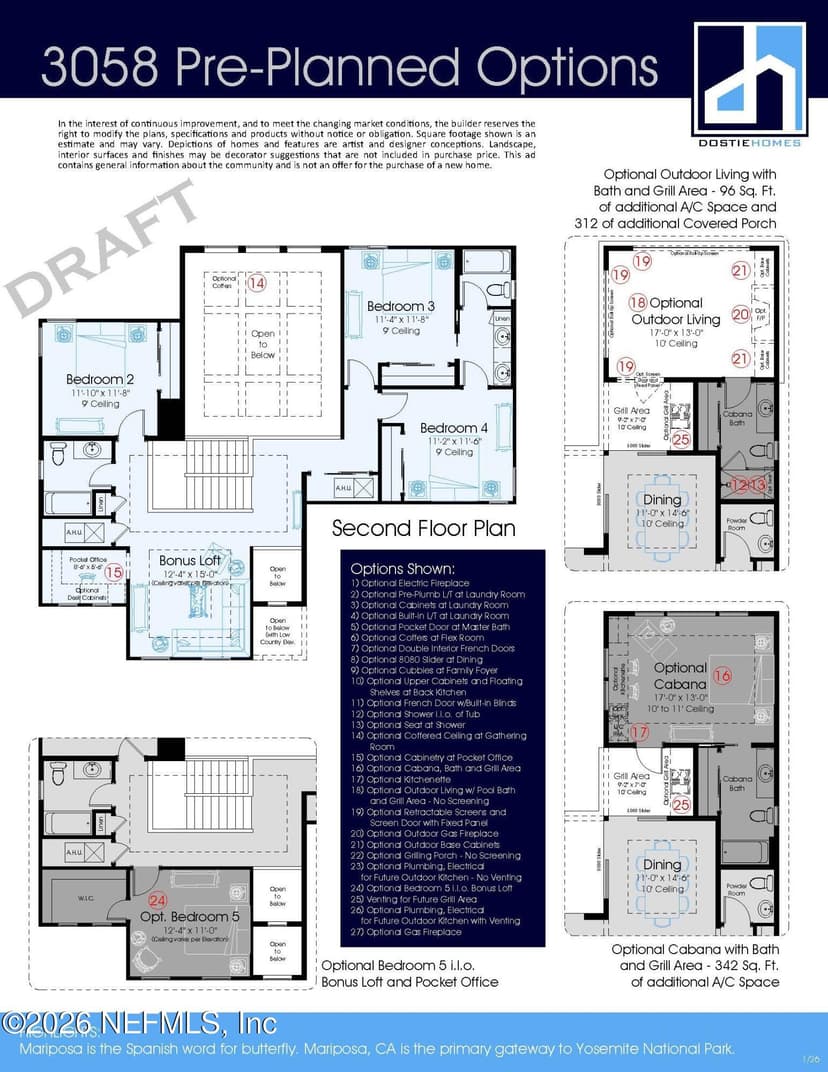
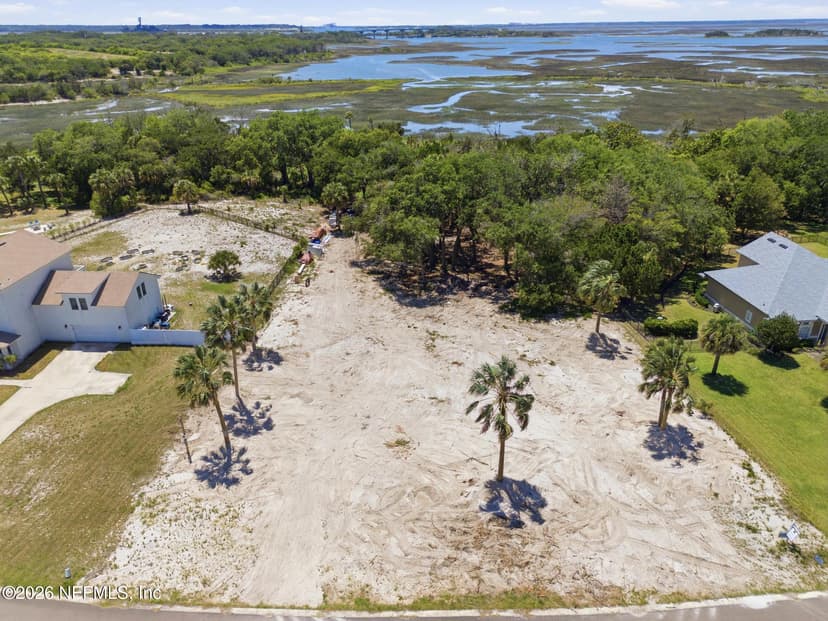
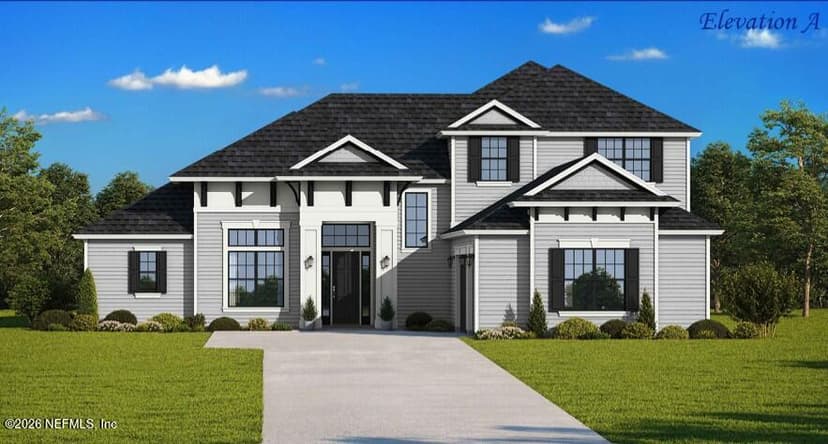
Closed sales
What waterfront homes in Jacksonville actually sold for
Median closed price by year from the MLS, 2019 to 2026: up 6% since 2025. 1075 sales closed in 2026 at a median $236 per square foot.
| Year | Sales | Median sold | $/sq ft | Of asking | Days on market |
|---|---|---|---|---|---|
| 2019 | 35 † | $490K | $171 | 97% | 33 |
| 2020 | 65 † | $570K | $216 | 98.5% | 52 |
| 2021 | 75 † | $445K | $184 | 100% | 20 |
| 2022 | 76 † | $500K | $221 | 99% | 32 |
| 2023 | 83 † | $433K | $216 | 97.8% | 39 |
| 2024 | 360 † | $475K | $239 | 97.7% | 37 |
| 2025 | 1282 | $470K | $232 | 97.3% | 46 |
| 2026 | 1075 | $497K | $236 | 97.5% | 37 |
Closed sales from the realMLS IDX feed; years with fewer than three sales are omitted. Medians, not estimates of any one home. "Of asking" is the median sold price as a share of the final list price. † A partial year in the feed: it carries only some of that year’s sales, so the median rests on fewer homes and the percent change above starts at the first full year.
This market, from the inside
Jacksonville is built around the water — the St. Johns River winds through the city, the Intracoastal runs behind the Beaches, and tidal creeks reach deep into the neighborhoods. The homes below carry a waterfront designation in the MLS.
Filter by price, beds, and pool below. For boaters, confirm navigability, water depth, and any fixed bridges between the property and open water.
Frequently asked questions
What water is most of this on?
A mix — the St. Johns River and its tributaries, Intracoastal frontage near the Beaches, tidal creeks, and community lakes and ponds. Each listing’s waterfront type comes from the MLS.
Looking for waterfront homes in Jacksonville?
I’ll send new listings the moment they hit the market and walk through the details that don’t show up in the MLS — water access, HOA rules, what a feature really costs to maintain.
Contact KristaThinking of selling?
What’s your Jacksonville home worth?
The sales above are the comp set a buyer will see. When you want a real number for your own home, Krista prepares it personally — no algorithm guesses — from the MLS-recorded sales in Jacksonville, backed by 20+ years and 500+ closings in Northeast Florida.
Get my Jacksonville home value →